Abstract blurred image with a dark background, featuring soft, glowing shapes in green and purple tones—evoking the mysterious ambiance of Operation Outbreak—creating a smooth and atmospheric gradient effect.

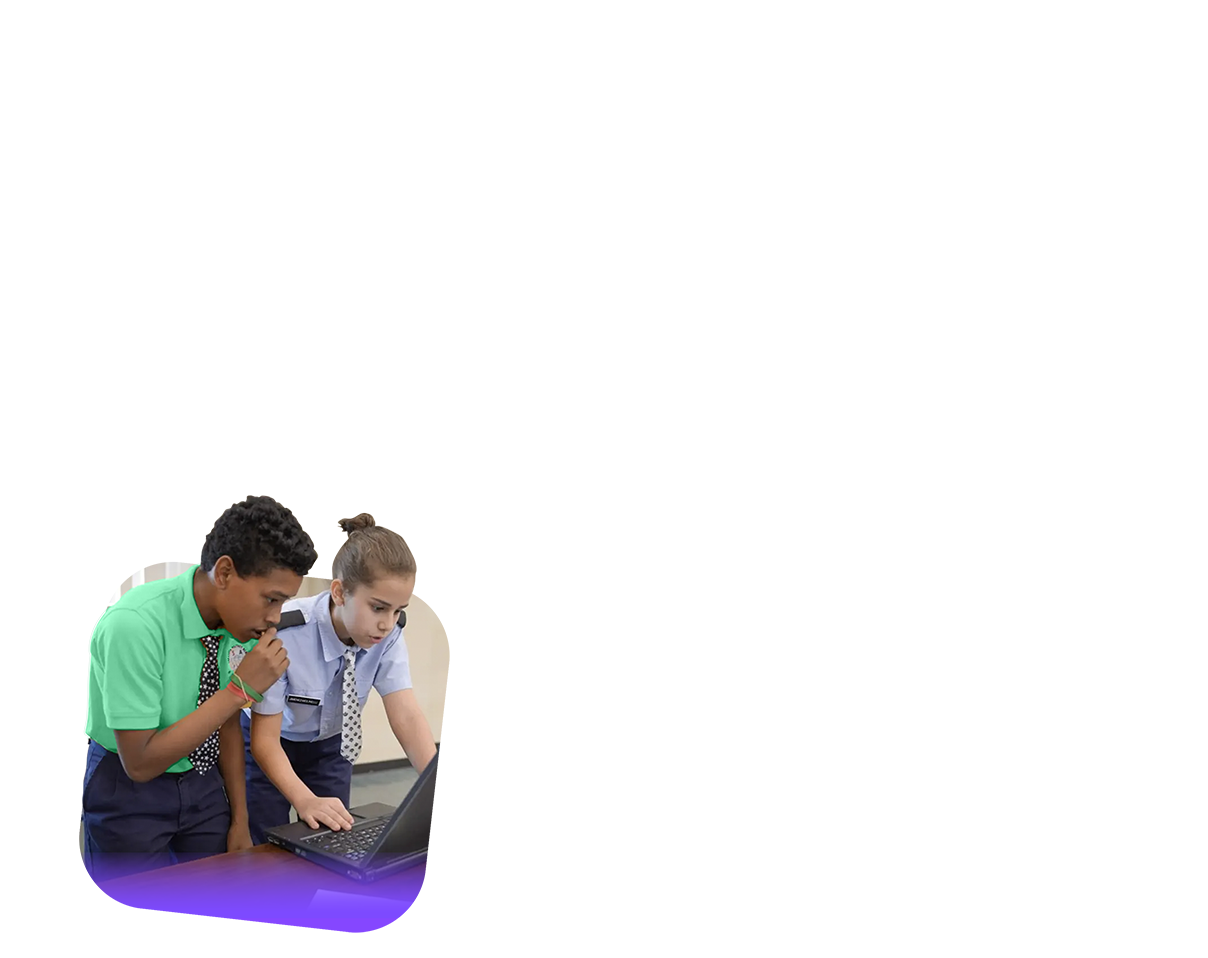
Ready, set, respond.

Turn your classroom, workplace, or any group setting into an interactive lab for outbreak response.

Choose

CORE VS. ENHANCED

Our two-tiered simulation suite engages participants where they are and elevates their understanding of outbreak science.

Two students in school uniforms look at a laptop together, appearing focused and engaged, as they participate in Operation Outbreak, with a beige and black abstract background above them.
Two young women stand close together, one holding and reading from a sheet of paper, both focused. Dressed in dark clothing, they appear deep in discussion about Operation Outbreak, with colorful geometric shapes at the bottom of a blank background.

Build

Outbreak Creator

Pick your date, time, group size, set the simulation “speed”, and for Enhanced, assign roles.

A tablet displays a dark-themed Operation Outbreak account creator form with fields for general information—username, password, email, and domain—set against a black background with blue and green gradient streaks.
A tablet displays a dark-themed interface titled "Outbreak Creator," featuring form fields, drop-down menus, and buttons for configuring Operation Outbreak settings. The background showcases abstract blue and purple gradients.

Experience

mobile app
  1. Participants download.
  2. Enter Join Code.
  3. Let the outbreak begin.
A tablet and two smartphones display health monitoring apps; the tablet shows a detailed patient record, while the phones—used for Operation Outbreak—show "HEALTHY" with a green smiley and "SICK" with a red face, each with protection status and time details.
Two smartphones display the Operation Outbreak health status app: one shows "Healthy" with a green screen and smiley face, the other shows "Sick" with a red screen and frowning face. Both screens list protection status and health details.

Review

Outbreak Visualizer

See the data unfold—curves, maps, and decision heatmaps at your fingertips.

A tablet displaying an Operation Outbreak data visualization dashboard with various graphs, charts, and colorful dots on a dark background; abstract colorful shapes appear in the background.
A tablet displays a data visualization dashboard with clustered colored dots, charts, and graphs on a dark background, showcasing analytics and interactive data points related to Operation Outbreak statistics.
An open booklet displays text, tables, and diagrams about general guidelines for work units and funding & duration, featuring highlighted sections, cellular illustrations inspired by Operation Outbreak, and organized data on white pages with green and purple accents.

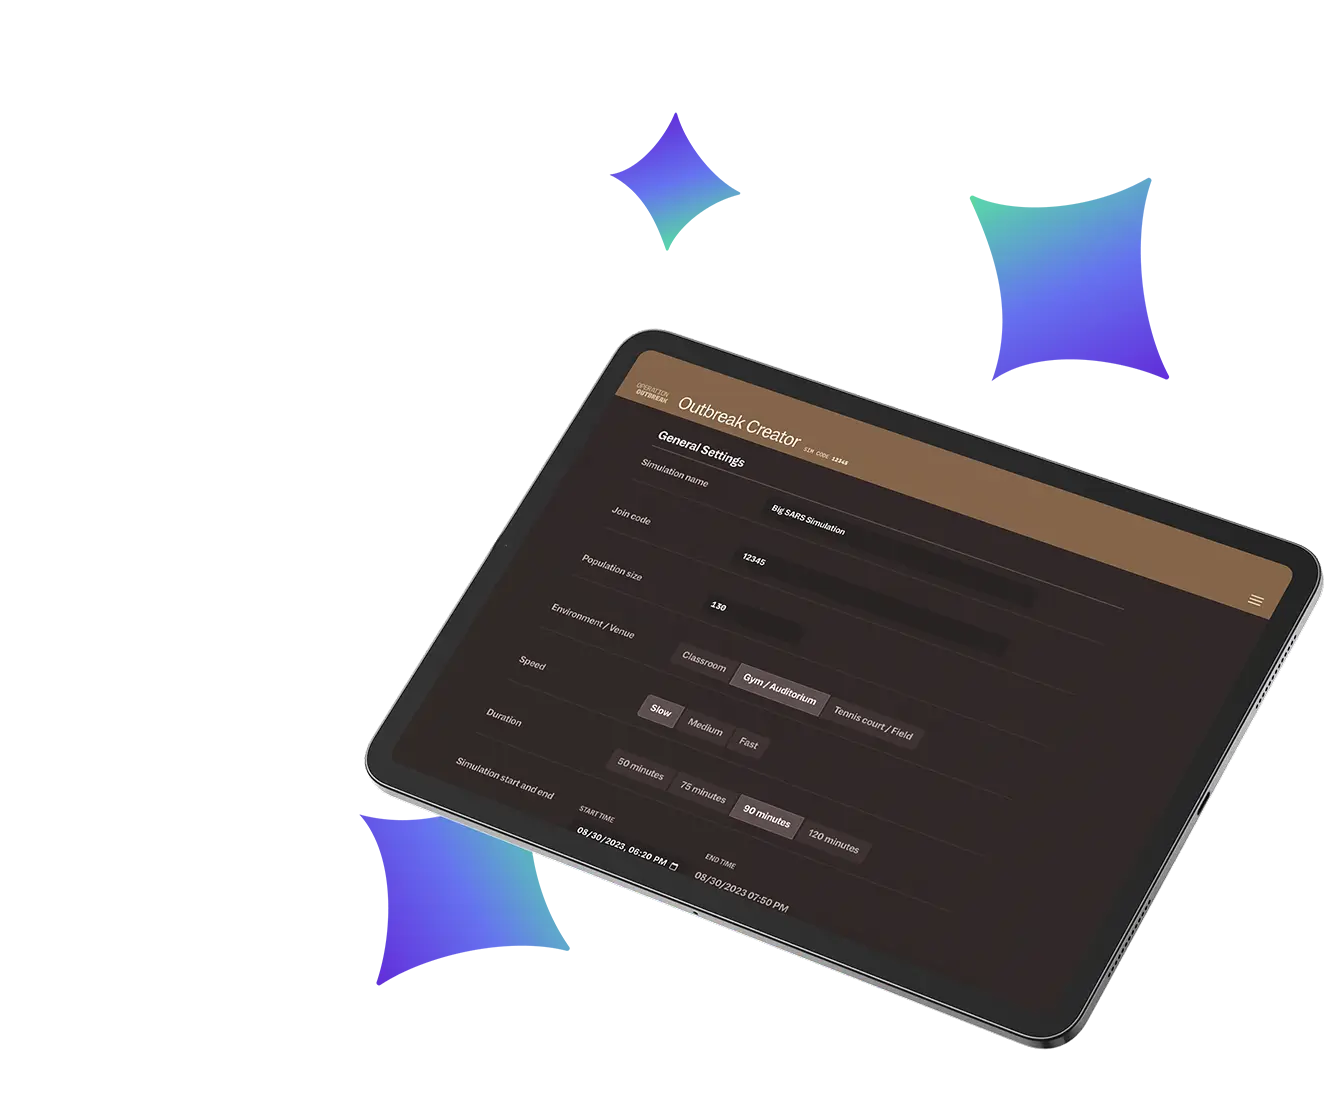
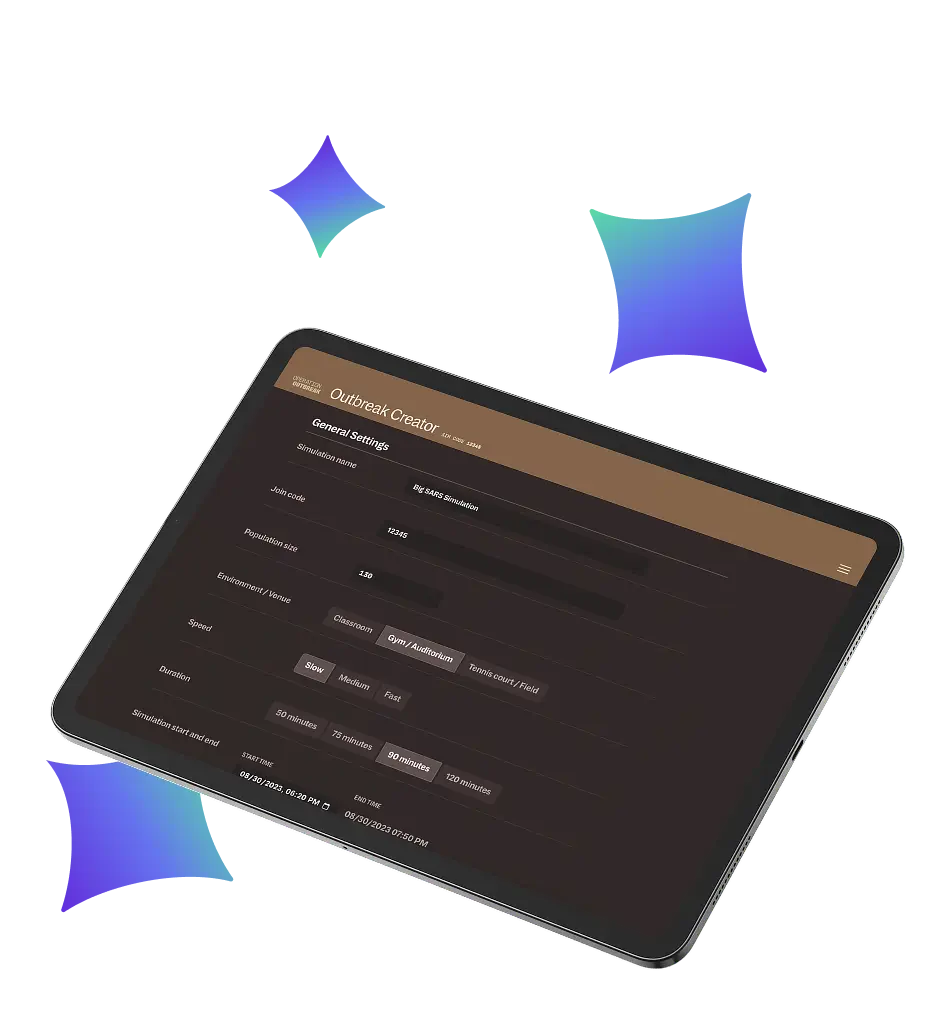
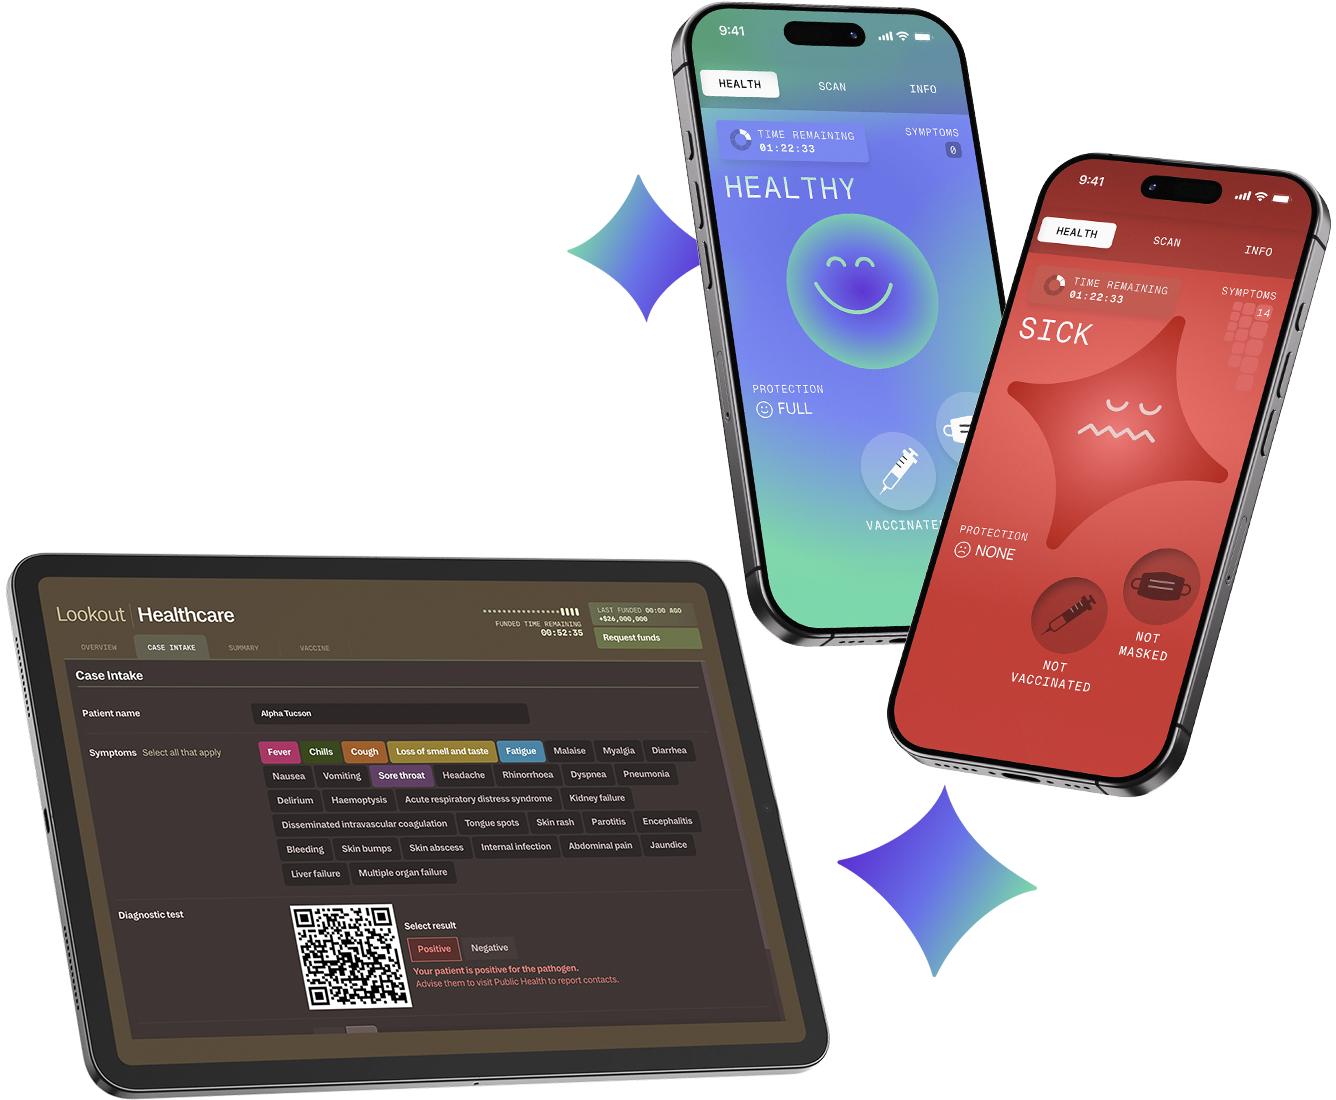
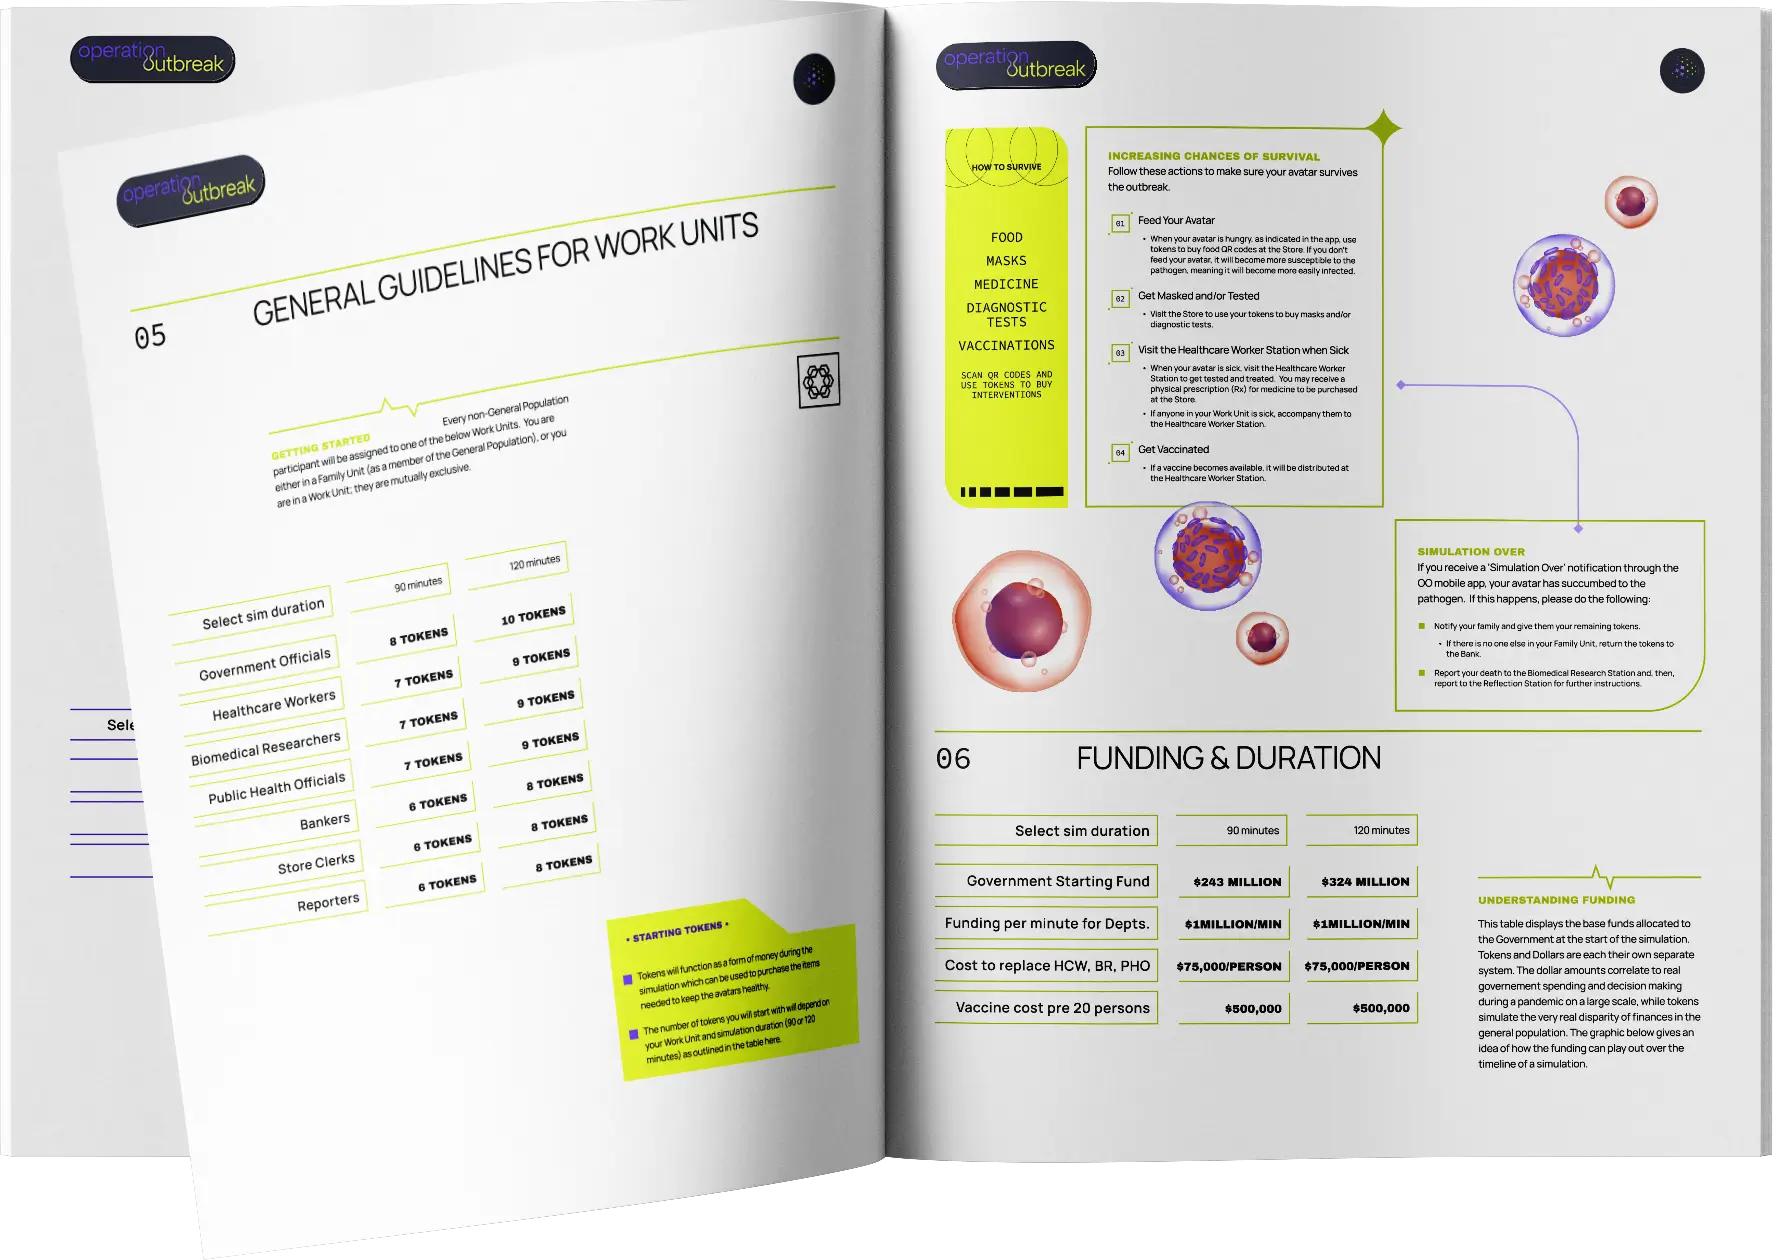
The Guidebook: Your Must-Read for Enhanced Simulations.

Step-by-step instructions, role templates, planning tips, and debrief exercises ensure you nail every detail of setup and play.